
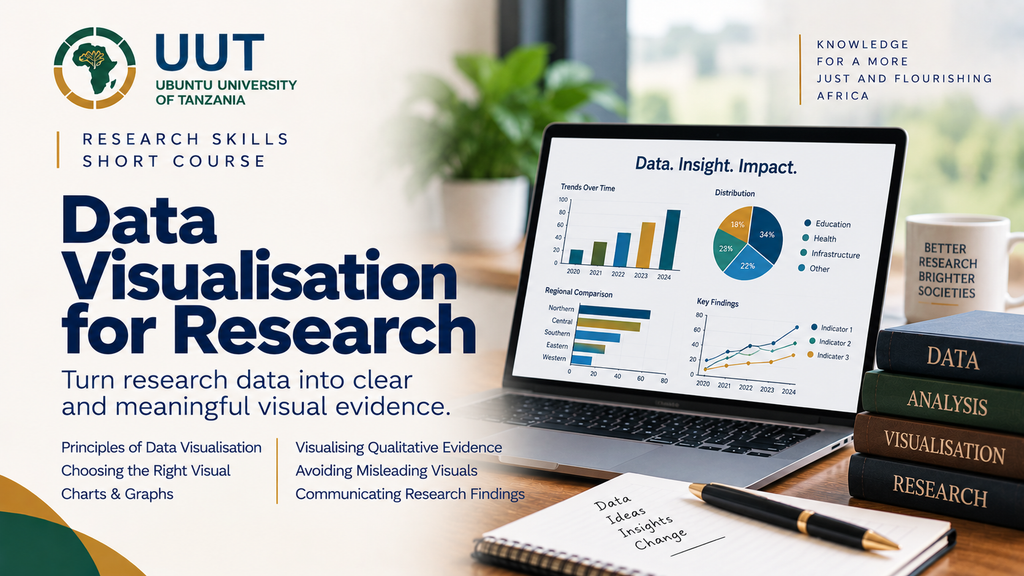
Turn Research Data into Clear and Meaningful Visual Evidence
The Data Visualisation for Research short course develops practical skills for presenting research data clearly, accurately and effectively. It is designed for postgraduate students, researchers, academics and professionals who want to communicate quantitative and qualitative evidence through appropriate visual forms.
What You Will Learn
By the end of the course, you should be able to:
- understand the principles of effective data visualisation;
- select appropriate visualisations for different types of research data;
- create clear and accurate charts, graphs and other visual displays;
- identify and avoid misleading visual representations;
- improve the readability and presentation of research findings; and
- use visual evidence effectively in reports, publications and presentations.
What the Course Covers
Principles of Data Visualisation — clarity, accuracy, simplicity and purpose.
Choosing the Right Visual — matching visualisation techniques to different types of data.
Charts & Graphs — presenting patterns, relationships, comparisons and trends.
Visualising Qualitative Evidence — presenting themes, relationships and conceptual patterns.
Avoiding Misleading Visuals — recognising common problems and improving visual integrity.
Communicating Research Findings — integrating visual evidence into academic and professional outputs.
Course Information
Category: Data & Analysis
Duration: 2 weeks
Learning Effort: Approximately 3–4 hours per week
Mode: Online, flexible learning
Learning Platform: UUT Moodle
Intake: Open throughout the year
Join the Course
Develop the ability to transform research data into visual evidence that people can understand and use.
Already registered or enrolled?
See the patterns. Present the evidence. Communicate with clarity.